Portuguese legislative election, 2002
|
||||||||||||||||||||||||||||||||||
|
230 seats to the Portuguese Assembly 116 seats needed for a majority |
||||||||||||||||||||||||||||||||||
|---|---|---|---|---|---|---|---|---|---|---|---|---|---|---|---|---|---|---|---|---|---|---|---|---|---|---|---|---|---|---|---|---|---|---|
|
||||||||||||||||||||||||||||||||||
|
||||||||||||||||||||||||||||||||||

| Portugal |
 This article is part of the series: |
The Portuguese legislative election of 2002 took place on 17 March. These elections were called after the resignation of the former Prime-Minister, António Guterres after a defeat of the Socialist Party in the local elections. That fact, plus the problematic state of the country's finances were the main arguments of the right-wing parties, which led them to win the election.
With just over 40% of the votes cast, the Social Democrats regained the status as the largest political force in Portugal, although the Socialists won almost 38% of the vote. This was, and still is, the smallest difference between the two major parties in Portugal. This short distance also appears on the electoral map, with each party winning eleven of the 22 districts, where the PS won the most populous, Lisbon and Porto. As a result, the Social Democrats fail to win the absolute majority they had between 1987 and 1995.
As no Party got an absolute majority, the Social Democrats formed a coalition with the right-wing People's Party. The left-wing Democratic Unity Coalition achieved the lowest result ever, finishing in the third place in its traditional strongholds, Évora and Setúbal. The Left Bloc gained one MP. Turnout was slightly higher than it was in 1999 but remained quite low, marking a growing separation between the politics and the Portuguese people, mainly due to the image of the politicians as corrupts and the idea that all the parties are the same.
Voter turnout was slightly higher than in 1999, as 61.5% of the electorate cast a ballot.
Contents
Parties
The major parties involved and the respective leaders were:
- Left Bloc (BE), Francisco Louçã
- Democratic Unity Coalition (CDU), Carlos Carvalhas
- Socialist Party (PS), Ferro Rodrigues
- Social Democratic Party (PSD), José Manuel Durão Barroso
- People's Party (CDS–PP), Paulo Portas
José Manuel Durão Barroso, leader of the Social Democratic Party, was nominated Prime Minister and formed a coalition government with the People's Party.
Opinion Polling
<templatestyles src="Module:Hatnote/styles.css"></templatestyles>
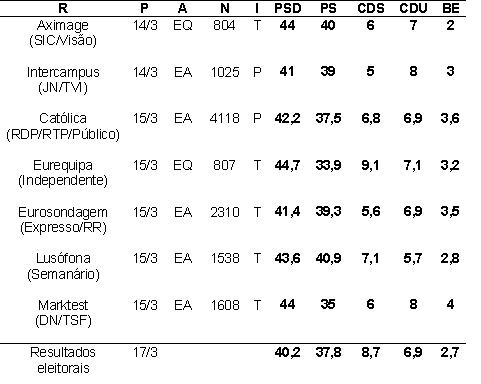
The following table shows the opinion polls of voting intention of the Portuguese voters before the election. Those parties that are listed are currently represented in parliament. Included is also the result of the Portuguese general elections in 1999 and 2002 for reference.
| Date Released | Polling Firm | PSD | PS | CDU | CDS-PP | BE | Others | Lead | |
|---|---|---|---|---|---|---|---|---|---|
| 17 Mar 2002 | Leg. Election | 40.2 105 seats |
37.8 96 seats |
6.9 12 seats |
8.7 14 seats |
2.7 3 seats |
3.7 0 seats |
2.4 | |
| 17 Mar (20:00) | RTP1 - Universidade Católica | 37.0 – 42.0 | 36.0 – 41.0 | 5.5 – 8.0 | 7.5 – 10.0 | 3.0 – 4.0 |
|
1.0 | |
| 17 Mar (20:00) | SIC - Eurosondagem | 40.1 – 43.9 | 35.5 – 39.3 | 6.2 – 8.4 | 6.2 – 8.4 | 2.0 – 3.4 |
|
4.6 | |
| 17 Mar (20:00) | TVI - INTERCAMPUS | 37.8 – 42.8 | 35.5 – 40.5 | 6.8 – 9.8 | 5.3 – 8.3 | 1.6 – 4.2 |
|
2.3 | |
| Exit polls | |||||||||
| 15 Mar | Marktest | 44.0 | 35.0 | 8.0 | 6.0 | 4.0 | 3.0 | 9.0 | |
| 15 Mar | Lusófona | 43.6 | 40.9 | 5.7 | 7.1 | 2.8 | N/A | 2.7 | |
| 15 Mar | Eurosondagem | 41.4 | 39.3 | 6.9 | 5.6 | 3.5 | 3.3 | 2.1 | |
| 15 Mar | Eurequipa | 44.7 | 33.9 | 7.1 | 9.1 | 3.2 | 2.0 | 10.8 | |
| 15 Mar | Universidade Católica | 42.2 | 37.5 | 6.9 | 6.8 | 3.6 | 3.0 | 4.7 | |
| 14 Mar | INTERCAMPUS | 41.0 | 39.0 | 8.0 | 5.0 | 3.0 | 4.0 | 2.0 | |
| 14 Mar | Aximage | 44.0 | 40.0 | 7.0 | 6.0 | 2.0 | 1.0 | 4.0 | |
| 13 Mar | SIC/Visão | 41.0 | 36.2 | 6.6 | 5.2 | 2.0 | 9.0 | 4.8 | |
| 8 Mar | Marktest | 43.0 | 36.0 | 6.0 | 7.0 | 4.0 | 4.0 | 7.0 | |
| 2 Mar | Eurosondagem | 38.0 | 35.0 | 6.0 | 5.0 | 2.0 | 14.0 | 3.0 | |
| 2002 | |||||||||
| 10 Oct 1999 | Leg. Election | 32.3 81 seats |
44.1 115 seats |
9.0 17 seats |
8.3 15 seats |
2.4 2 seats |
3.9 0 seats |
11.9% | |
National summary of votes and seats
| Parties | Votes | % | ± | MPs | MPs %/ votes % |
|||||||||
|---|---|---|---|---|---|---|---|---|---|---|---|---|---|---|
| 1999 | 2002 | ± | % | ± | ||||||||||
| Social Democratic | 2,200,765 | 40.21 | 81 | 105 | 45.65 | 1.14 | ||||||||
| Socialist | 2,068,584 | 37.79 | 115 | 96 | 41.74 | 1.10 | ||||||||
| People's | 477,350 | 8.72 | 15 | 14 | 6.09 | 0.70 | ||||||||
| Democratic Unity Coalition[A] | 379,870 | 6.94 | 17 | 12 | 5.22 | 0.75 | ||||||||
| Left Bloc | 149,966 | 2.74 | 2 | 3 | 1.30 | 0.47 | ||||||||
| Workers' Communist Party | 36,193 | 0.66 | 0 | 0 | 0.00 | 0.0 | ||||||||
| Earth Party | 15,540 | 0.28 | 0 | 0 | 0.00 | 0.0 | ||||||||
| People's Monarchist Party | 12,398 | 0.23 | 0 | 0 | 0.00 | 0.0 | ||||||||
| Humanist Party | 11,472 | 0.21 | 0 | 0 | 0.00 | 0.0 | ||||||||
| National Renovator Party | 4,712 | 0.09 | — | — | 0 | — | 0.00 | — | 0.0 | |||||
| Workers Party of Socialist Unity | 4,316 | 0.08 | 0 | 0 | 0.00 | 0.0 | ||||||||
| Left Bloc / People's Democratic Union[B] | 3,911 | 0.07 | — | — | 0 | — | 0.00 | — | 0.0 | |||||
| Total valid | 5,365,881 | 98.03 | 230 | 230 | 100.00 | — | ||||||||
| Blank ballots | 55,121 | 1.01 | ||||||||||||
| Invalid ballots | 52,653 | 0.96 | ||||||||||||
| Total (turnout 61.48%) | 5,473,655 | 100.00 | ||||||||||||
| A Portuguese Communist Party (10 MPs) and "The Greens" (2 MPs) ran in coalition.[3] B Left Bloc / People's Democratic Union joint electoral list only in Madeira. |
||||||||||||||
| Source: Comissão Nacional de Eleições | ||||||||||||||
Further reading
- Lua error in package.lua at line 80: module 'strict' not found.
References
External links
- Preliminary results of the 2002 election
- Comissão Nacional de Eleições
- Centro de Estudos do Pensamento Político
See also
| Presidential elections | |
|---|---|
| Parliamentary elections |
|
| Constituent Assembly elections | |
| Local elections | |
| European elections | |
| Referendums | |
|
|